 |
|
Figure
1.
|
Exploring
Species Distributions
Using ArcExplorer or ArcView
Return to the exercise home page
Key
Concepts:
1. Geographic
Information Systems
2. Species Distribution
3. Habitat relationships
4.
Environment variables
Introduction:
In this activity,
you will learn to use ArcExplorer for viewing spatial data. Although this
activity was written specifically to be done with ArcExplorer, you can accomplish
the same tasks using ArcView (often using the same procedures). These
software packages are considered Geographic Information Systems (GIS).
While using one these GIS software packages, you will explore what factors might
influence the distribution of the Great Basin Spadefoot toad.
You will also examine the issue of responsibility for protecting the Great Basin
Spadefoot toad. Finally, you will have the opportunity to work on some
of the same questions for other species.
Download
Data:
Before beginning
this exercise, you will need to have ArcExplorer installed on your machine (click
here to download ArcExplorer). You will also need to download the
data zip files.
Click one each of the four data zip files to download them. Place them in a folder called spadefoot and then double click on them. The data will then be installed on your computer.
-basemap.exe
3.5 mb
-envidata.exe
7.1 mb
-owndata.exe
5.7 mb
-scindist.exe
0.3 mb
| Note: If you are downloading from the internet, three of these zip files are large and could take a long time. If possible use the CD-ROM instead. Mac Users: Zipit and ArcExplorer are PC native programs and may require a Windows emulator to use these files. |
Introduction
to Spatial Data:
Geographic
Information Systems are an important tool for scientists to understand how spatial
information, such as temperature, soil types, or vegetation are distributed
across an area.
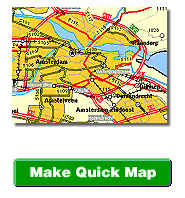
If you have
a connection to the internet, go to the ESRI mapping page at
http://www.esri.com/data/online/index.html
Figure
1.
| Note: This will bring up a new window, when you are finished, close the window to return to this page |
1. List what spatial data is associated with the map.
Most of us are familiar with roadmaps described above, however, we often see spatial data used to map other things such as weather.
If you have a connection to the internet, go to the Weather Channel current weather map at
| Note: This will bring up a new window, when you are finished, close the window to return to this page |
1.
List what spatial data is associated with the map.
2. What other types
of weather data could be mapped?
Building
a Base Map:
Since you now have a feel
for what spatial data is, let's create a base map to be used for other portions
of this exercise. To help you use ArcExplorer, there are help images which
are screen-captures (or a set of screen-captures) associated with each major task.
To show these help images in the
right hand frame, click
on the blue text.*
*Note:
all help images are from ArcExplorer however many of the tasks can be done
in ArcView using many of the same procedures
Start by opening either ArcExplorer and add all of the data layers in the base
map folder (adding data layers).
The list of layers
on the left hand side represent the order the layers will be shown. One
of the first things you will need to do is reorganize the layers so they can be
used for making a map (moving
data layers). Start by moving the Idaho relief map to the bottom of
your layer list and then turn it on . This will be the base layer that you
will put all other layers over. A shaded relief map is way of viewing
the mountains and valleys within an area. Move
the county boundaries just above the relief map and turn it on (turning
on layers). What you will find is the counties are filled with a color
and completely cover up the relief map. Since we want to see the relief
map and the counties at the same time, we need to change fill pattern to transparent
(changing colors and fill
patterns). Rearrange the layers and colors so they are in the
following order (from top to bottom):
1. Roads (red foreground)
2. Idaho Rivers (blue foreground)
3. Idaho Lakes (blue foreground)
4. Idaho hydrologic unit codes (HUC) (transparent foreground, orange outline)
5. Counties (transparent foreground, black outline)
6. Relief Map.
As you add new layers, you may need to modify their colors, fill patterns, and/or move them around so they can be shown more easily.
Exploring
Great Basin Spadefoot toad Distribution:
GIS Help:
(adding
data layers)(moving data
layers)(turning on layers)
(changing colors and fill
patterns)
Introduction to spadefoot distribution.
A.
Turn on the Idaho counties and Spadefoot Toad layer. This layer represents
the areas that are predicted to have spadefoots. This predicted distribution
was generated from a number of variables, based on known locations where spadefoots
are found.
Factors potentially affecting spadefoot distribution.
| *Note: This will bring up info in this window, when you are finished, hit the browsers "back" button to return to this page. |
Click
here* to go to the Great
Basin Spadefoot toad species data.
We will use GIS to examine a few factors that might influence the distribution
of the Great Basin Spadefoot toads. Start by changing the fill style of
the spadefoot distribution to hatched yellow lines with a transparent background
and outline. You may need to change the color of the distribution layer
depending on what layers you are going to put it over.
Relief.
GIS Help:
(adding
data layers)(moving data
layers)(turning on layers)
(changing colors and fill
patterns)
B. Turn on the Idaho shaded relief map.
Environmental Factors.
GIS Help:
(adding
data layers)(moving data
layers)(turning on layers)
(changing colors and fill
patterns)
C. Environmental factors can greatly influence the distribution of a species. You will find themes for several environmental variables in the Other Factors folder. Turn on these layers one at a time and describe what environmental variables the spadefoot will encounter. Remember, you may need to modify or move the layers so they are seen more easily.
Conservation of the spadefoot.
GIS Help: (adding
data layers)(moving data
layers)(turning on layers)
(changing colors and fill
patterns)
D. Add and turn on all of the layers in the ownership folder. Remember, you may need to modify or move the layers so they are seen more easily.
Exploring
On Your Own:
Using the data
available on the CD, pick a species of Idaho's wildlife and explore what factors
might influence influence its distribution.