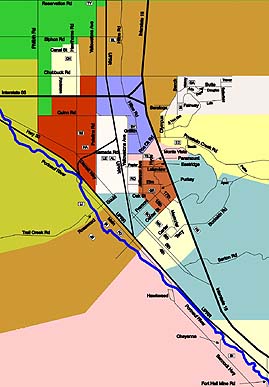
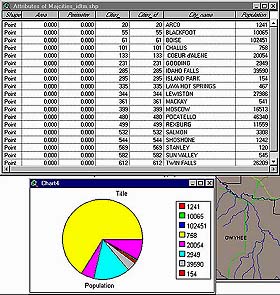
Usually this is a map or graphic, which the user has generated after analyzing the data. School districts can use GIS to help them in decisions like school boundaries and then create a map to distribute to the community. Tabular data and reports can be generated as well to help explain the details seen in the map or graphic and how the conclusions were derived.